You have written your first application in Elm. Congratulations my friend, the hard work has finally paid off. Now it’s time to relax and enjoy the pure bliss that is maintaining and refactoring Elm code.
But wait a second, someone tells you the app feels a bit sluggish to use. Mh. I thought that writing pure functions would automatically make code fast. Okay. Let’s try to stay calm.
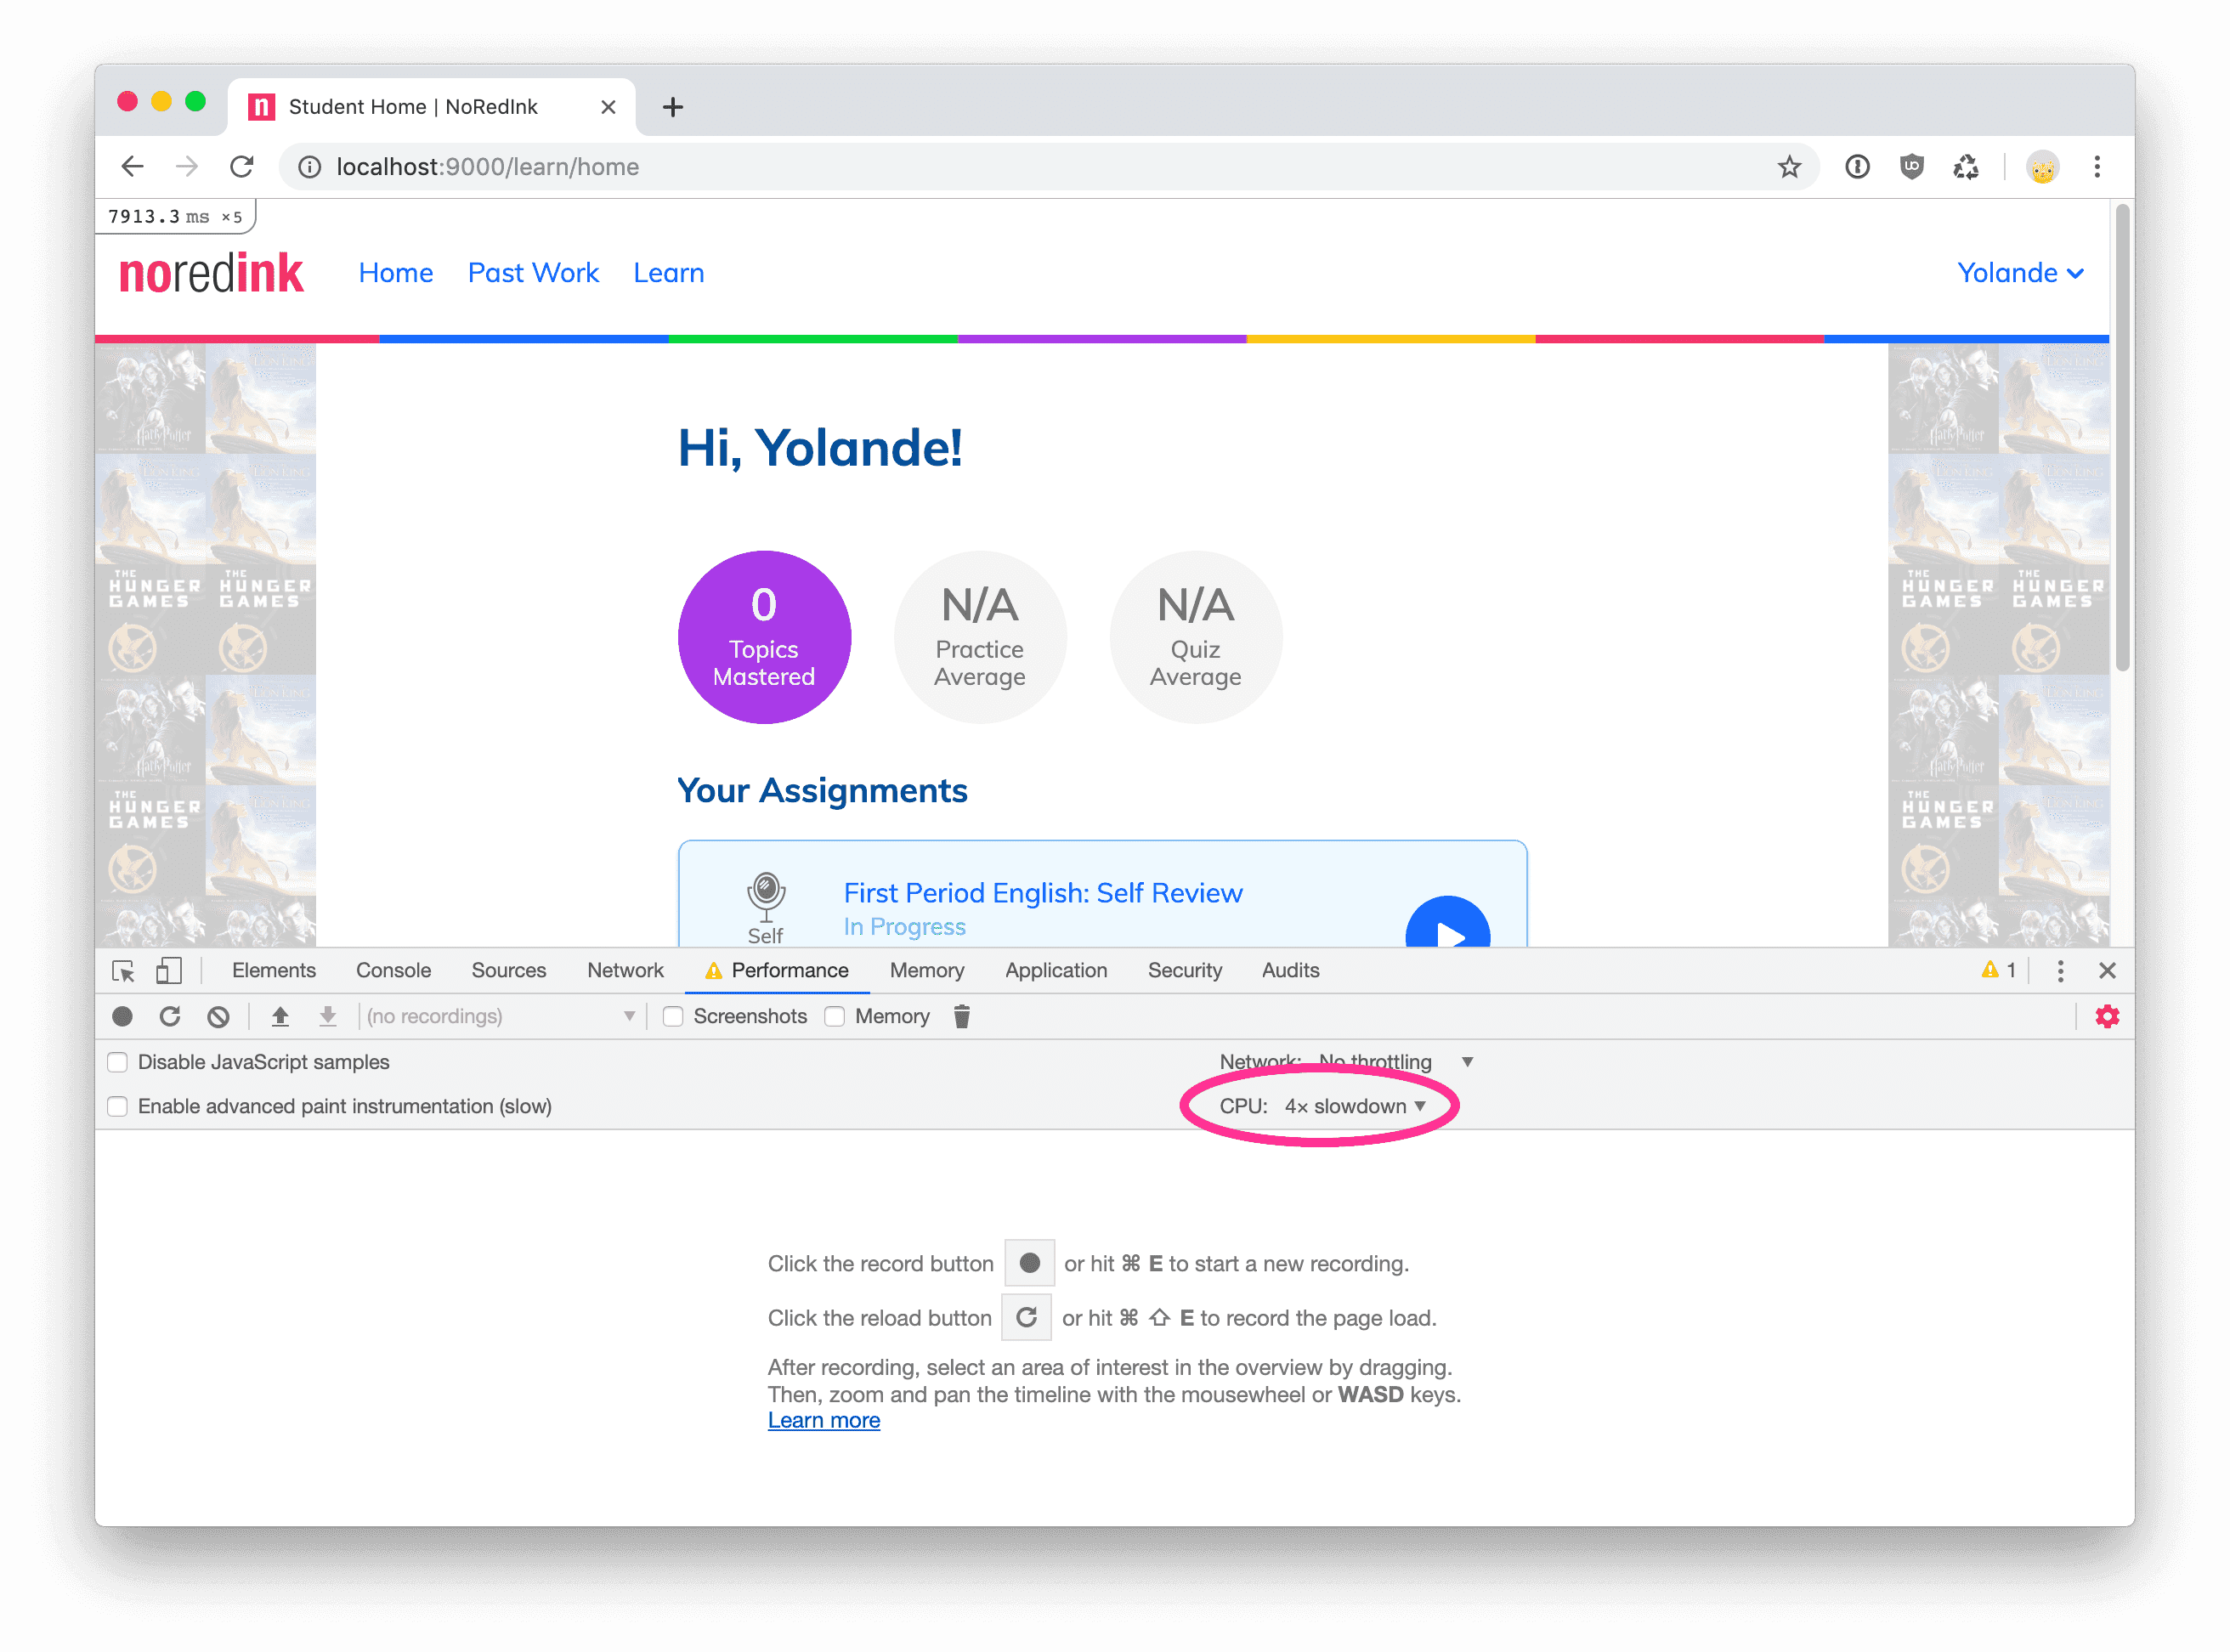
The app looks fast at a first glance. To be fair, you’re probably using a quad-core machine with 16 GB of RAM. Maybe you should see how the app behaves on a lower end device. In Chrome, you bring up the inspector, then go to Performance tab and choose how much you want to throttle your CPU.
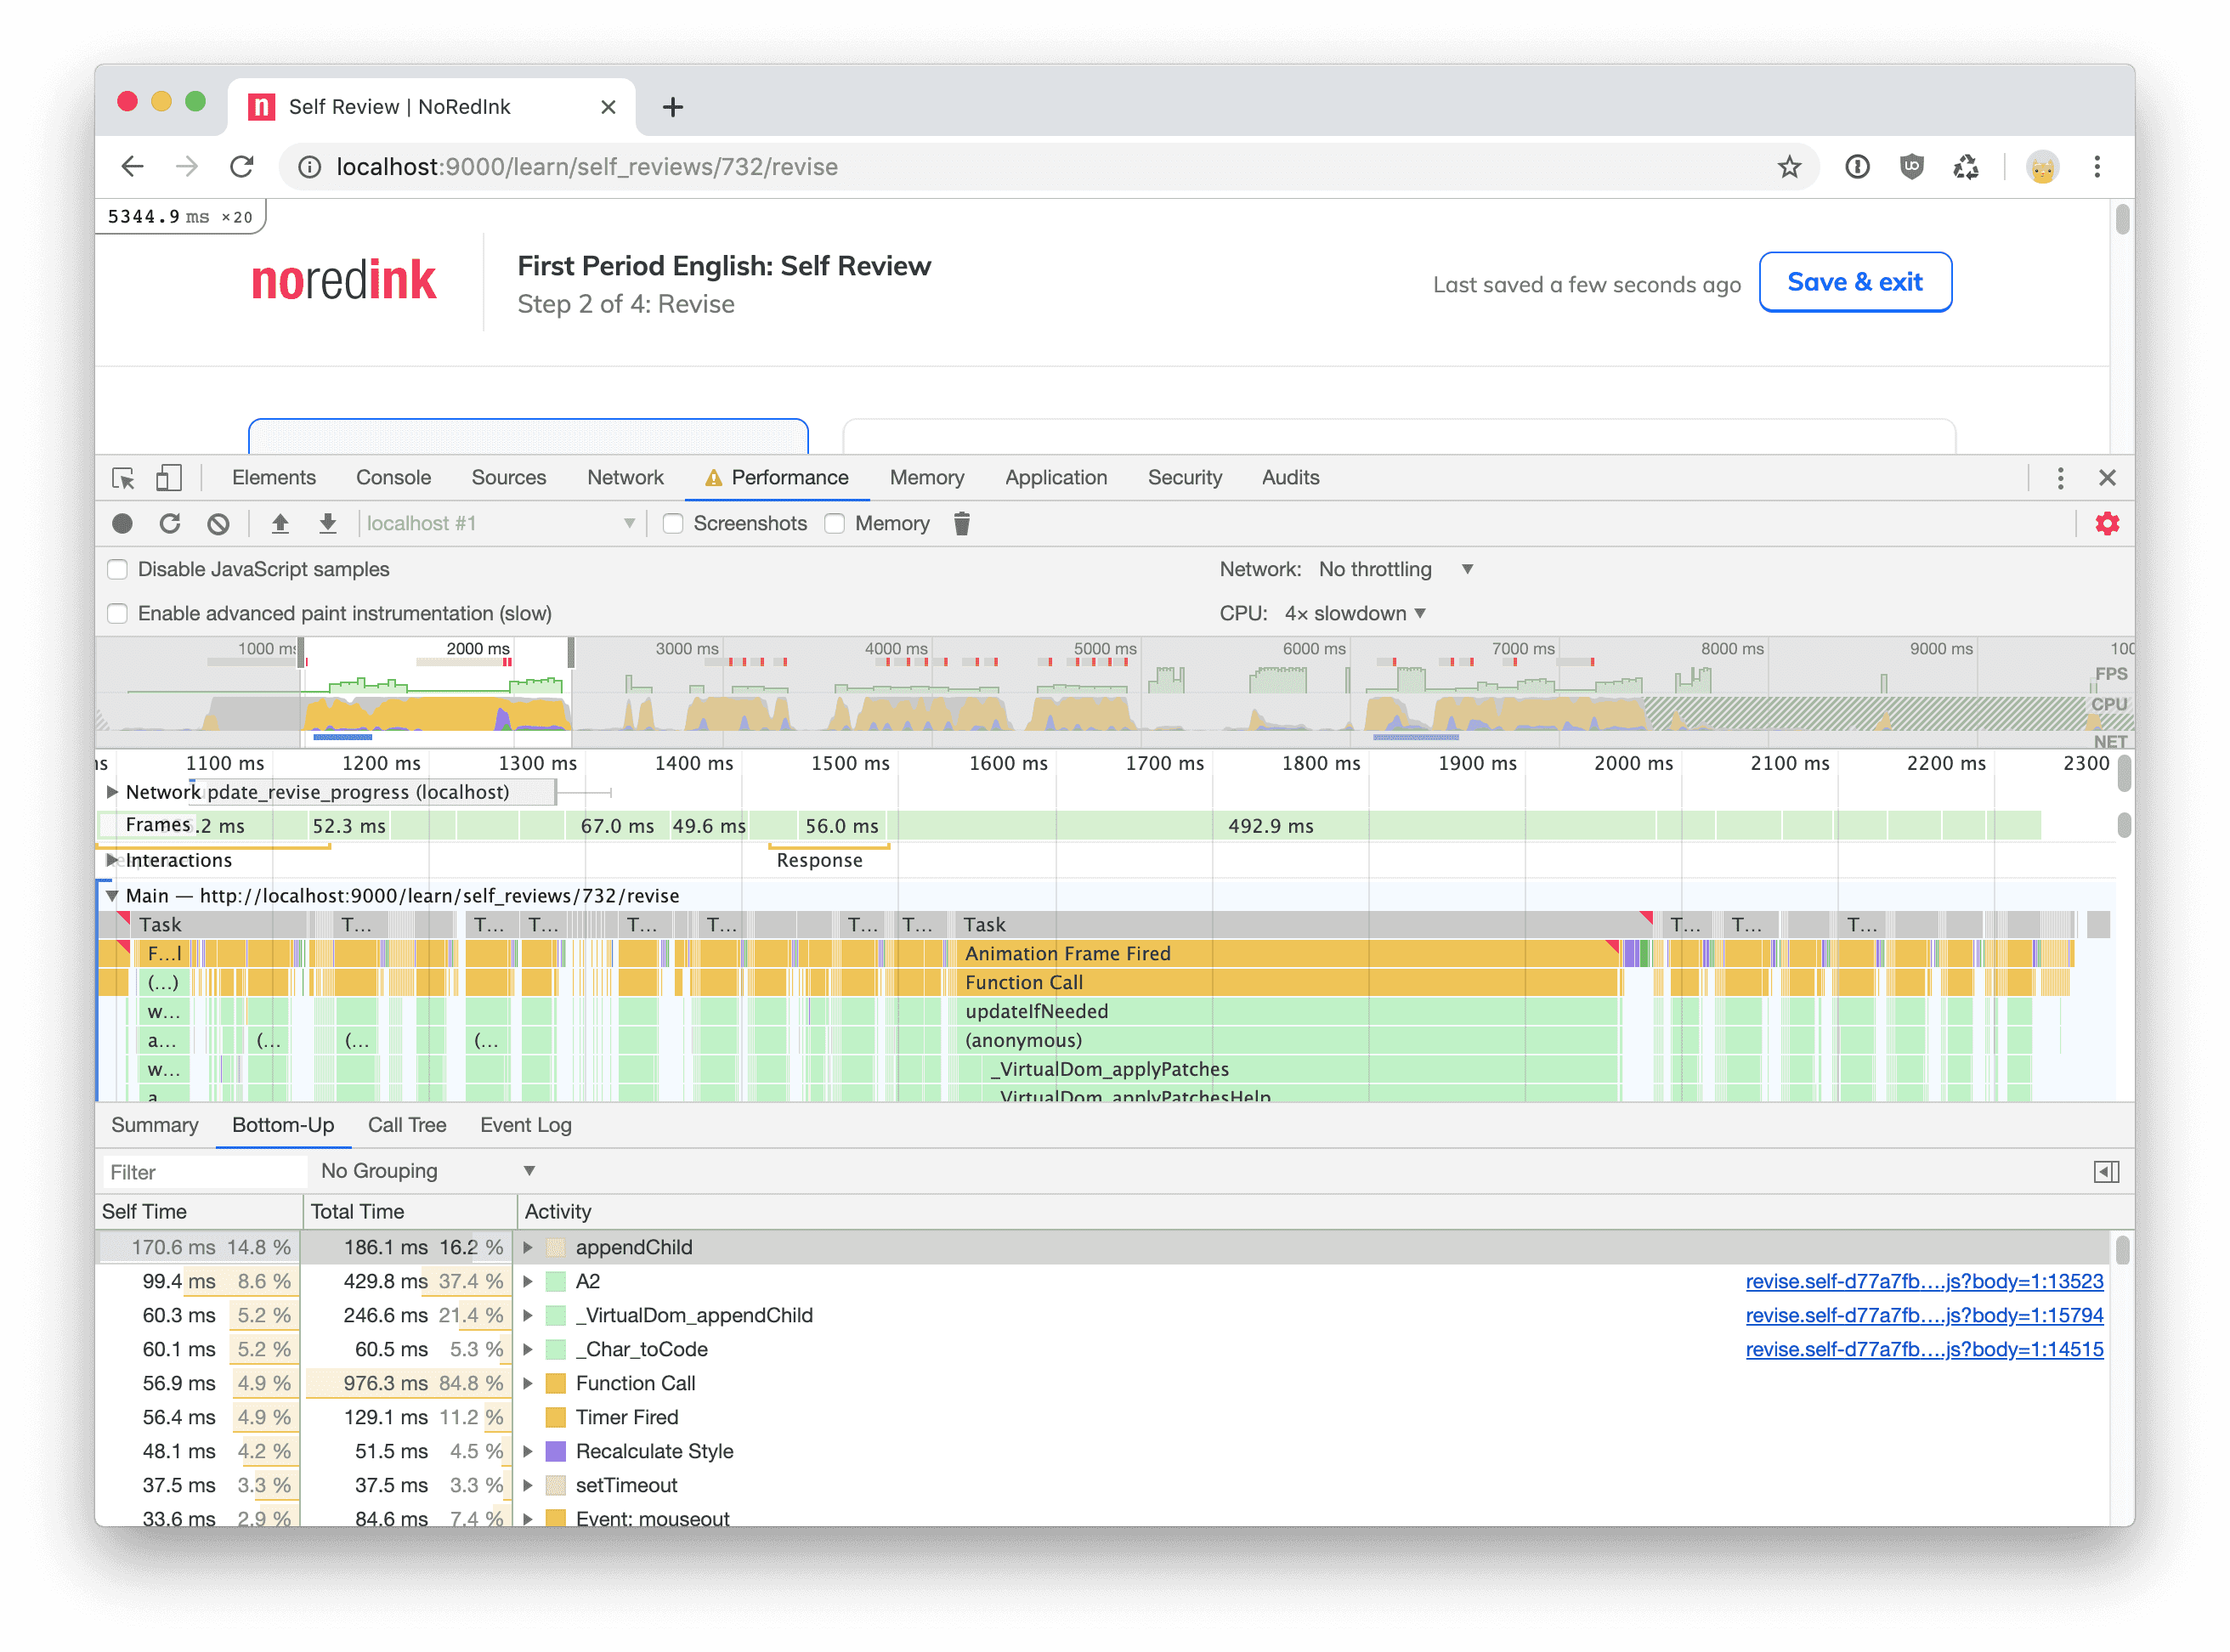
When you click around the app now, you can clearly see it’s quite sluggish. Mh. Time to unleash the power of the flamegraph. You can start recording a session, then click around the app as a normal user would. Easy peasy. When all is done, you should see something like this.
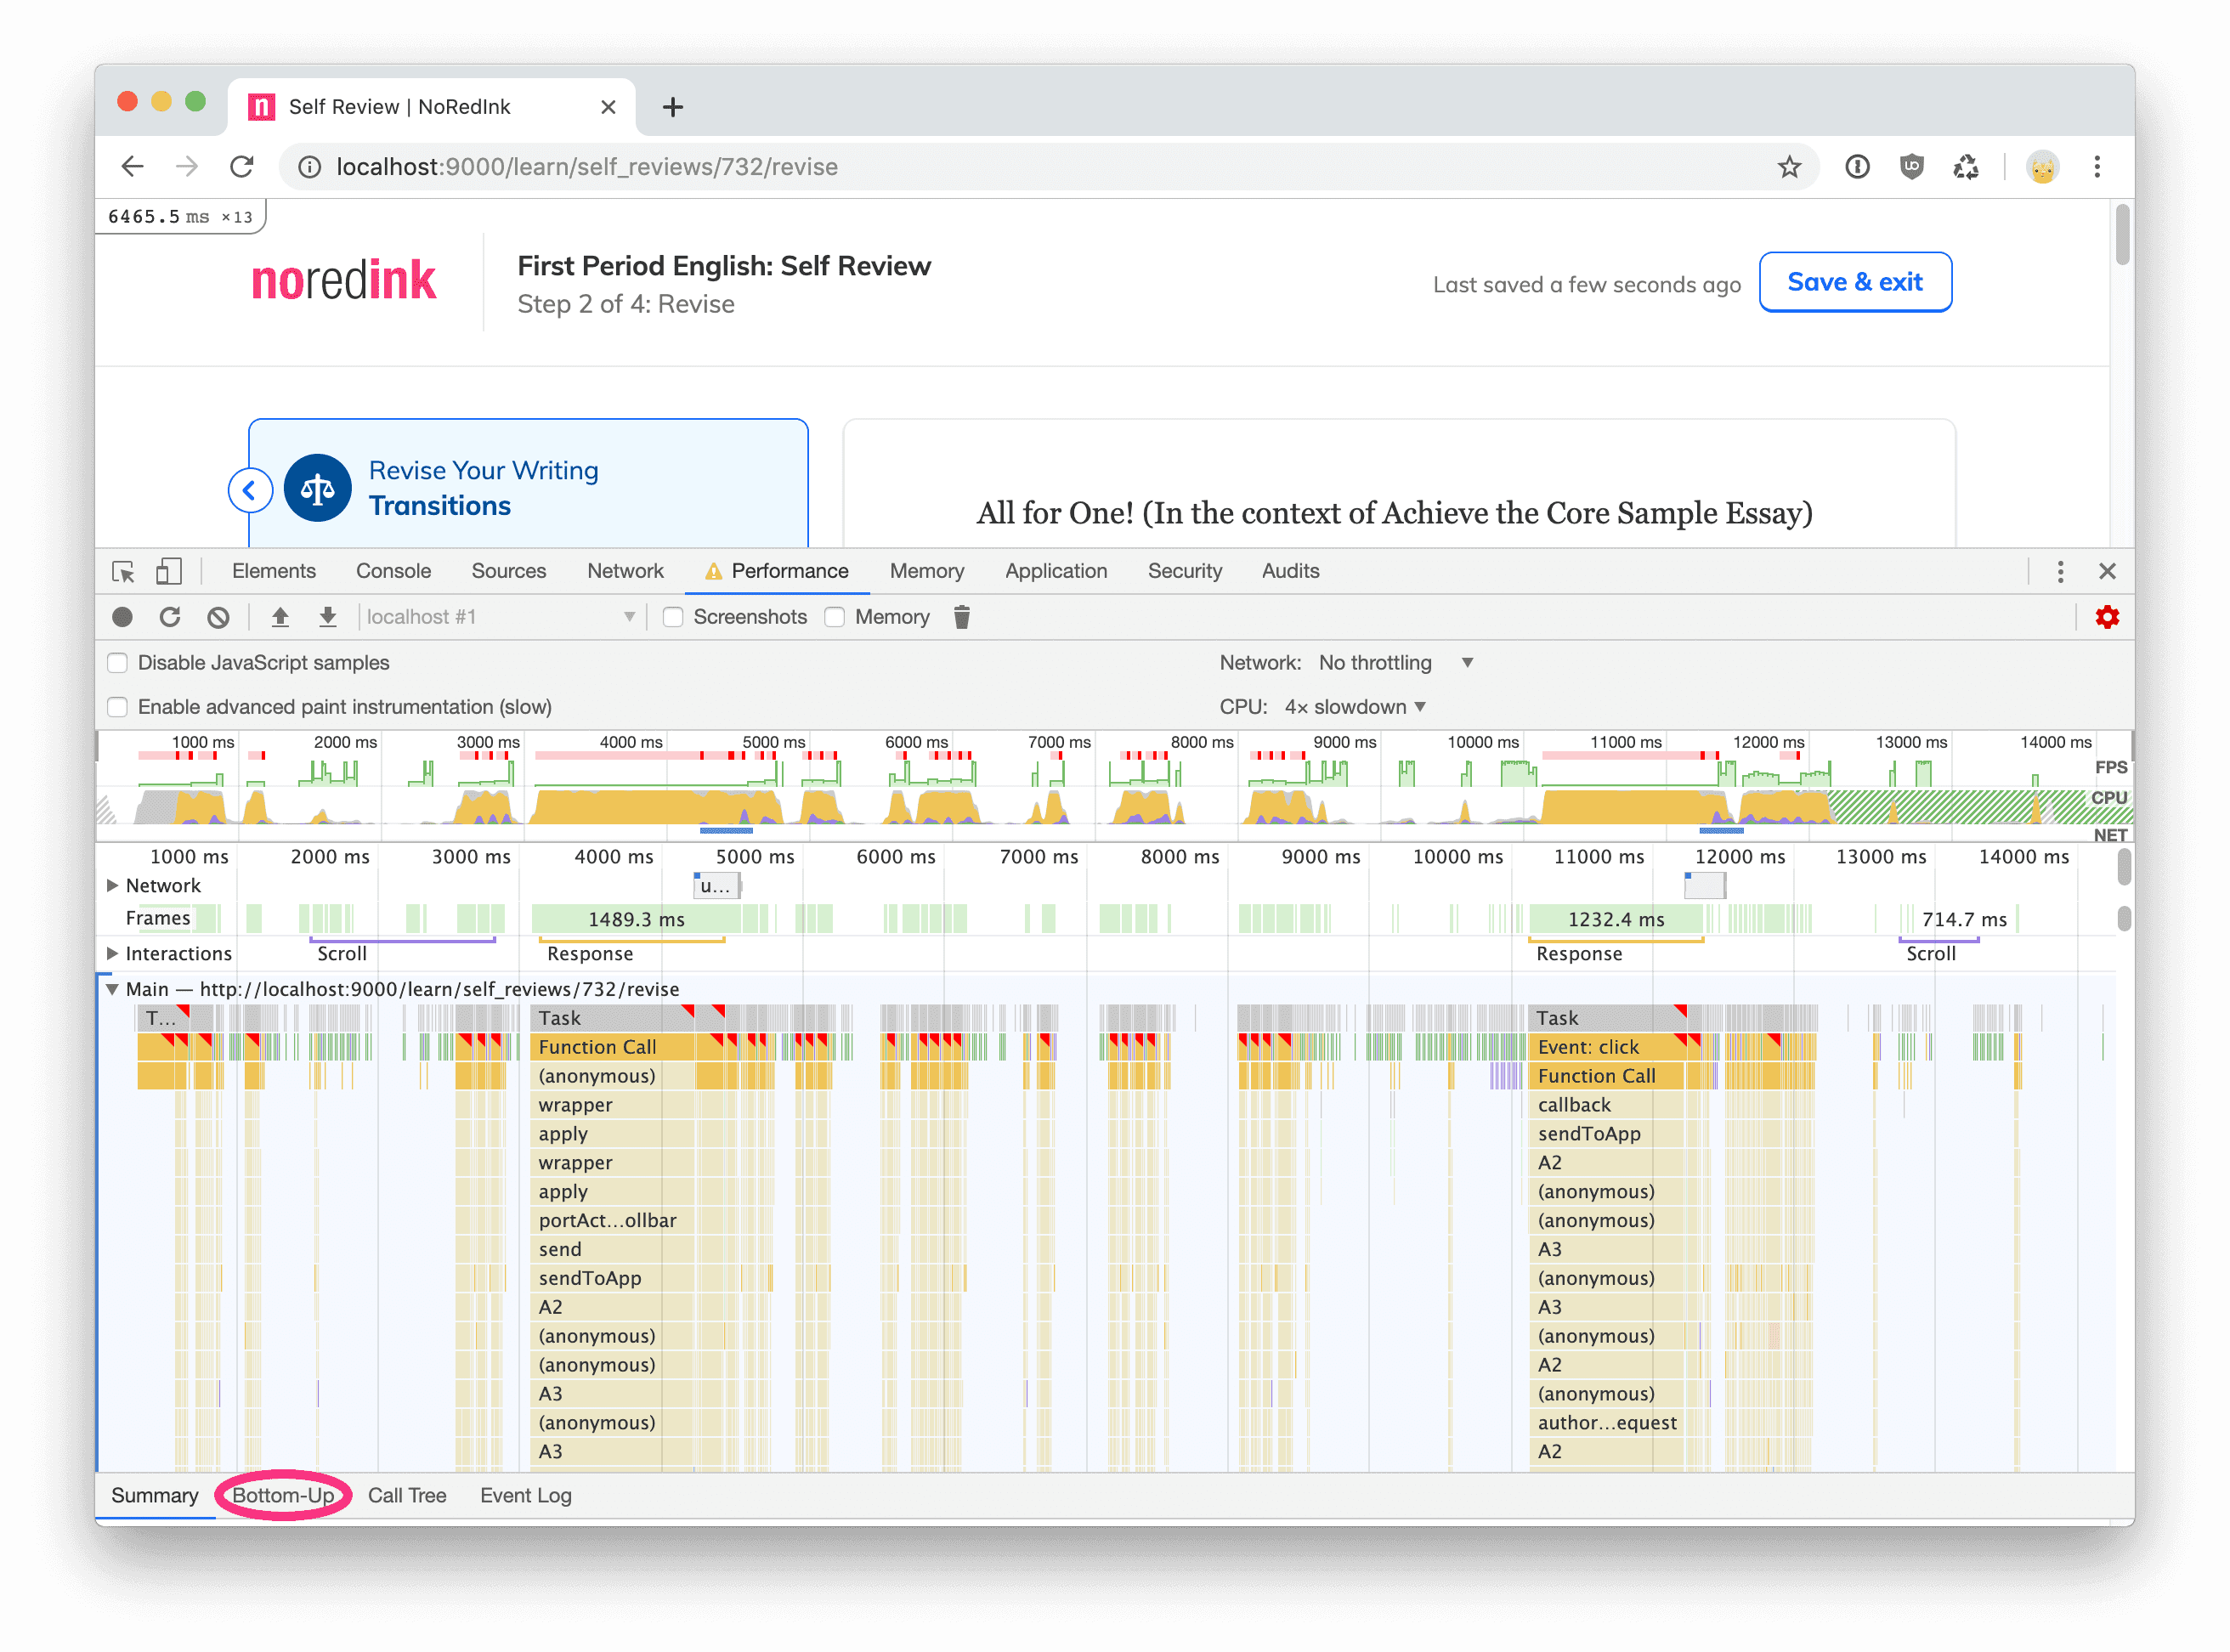
That looks quite exotic, but let’s not lose hope. The yellow parts of the graph represent the time your browser spent executing scripts, while the purple parts denote the time it took to render. You can also see small red corners scattered through the graph: those represent when the user has experienced noticeable delays while using the application. You can find out more information about what it means here.
You’ll also notice you can select a smaller time interval and start digging into more specific bits of what your application is doing at a certain time. For example, if you highlight the first big chunk of scripting and then look in the lower panel, you will find a tab named “Bottom-Up”.
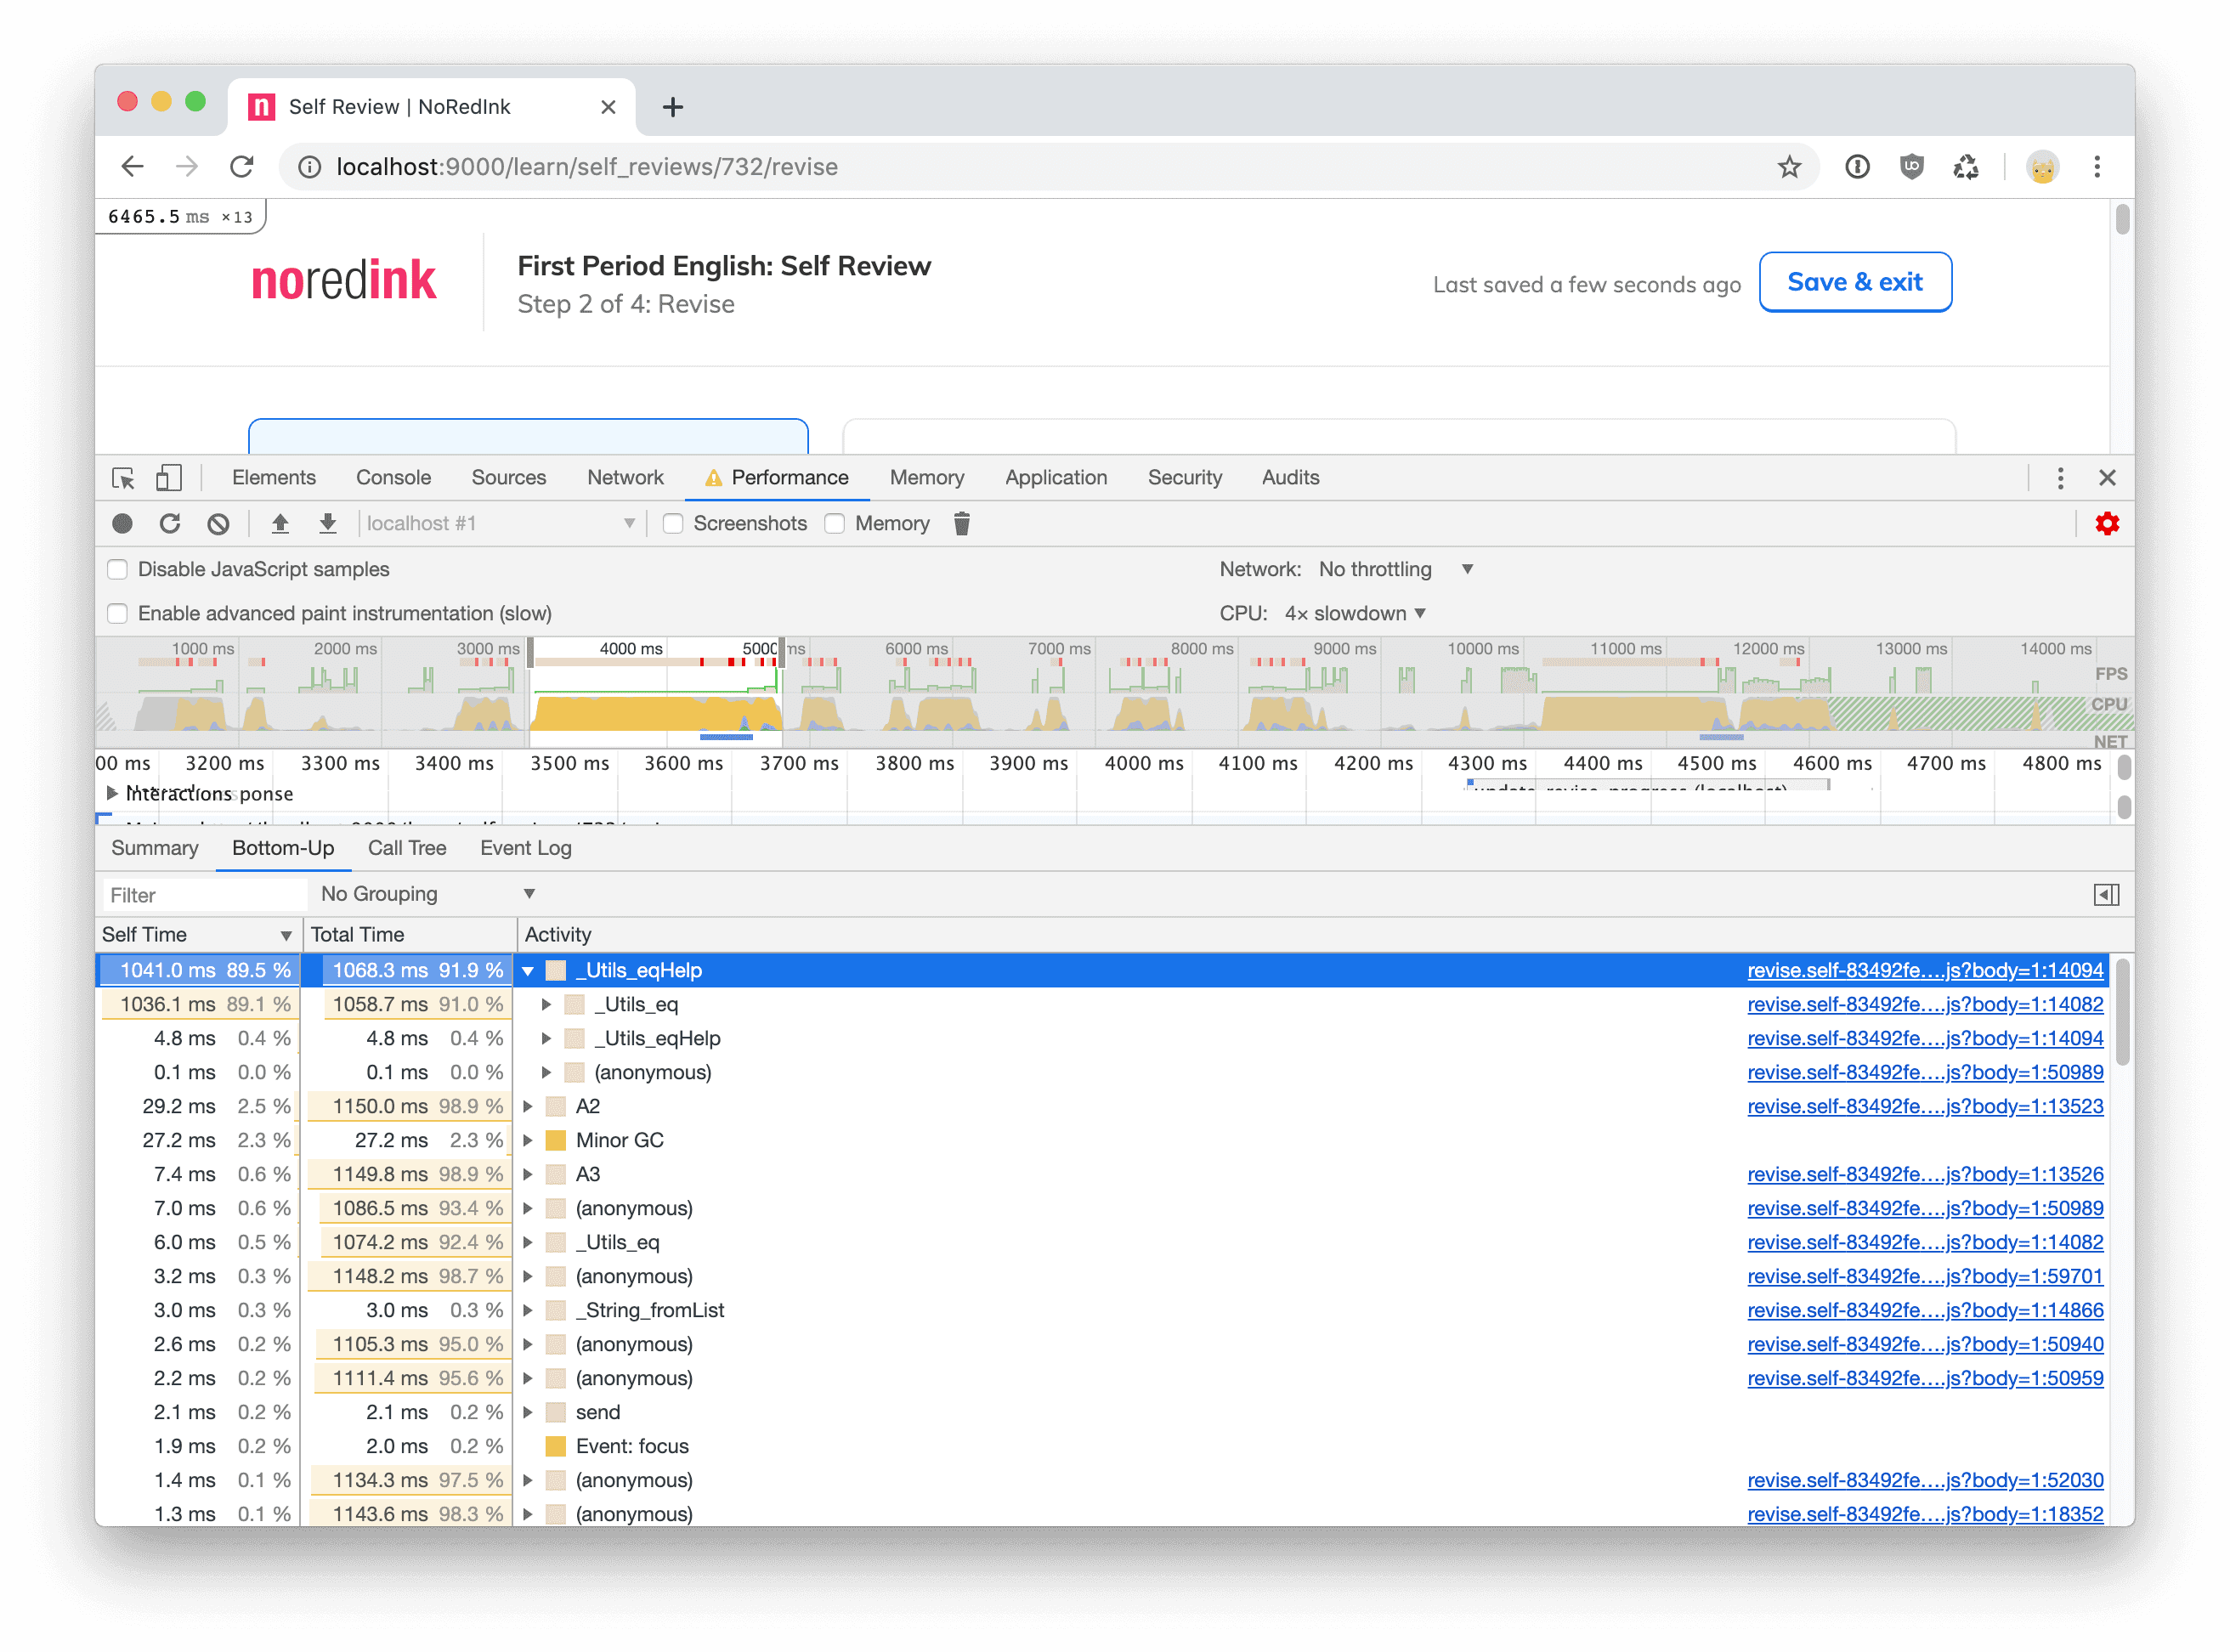
The first entry says _Utils_eqHelp, and apparently that function took the
most time to execute. This is curious, because we don’t expect our
application to spend so much time comparing things. By clicking on the
right hand side, we will be able to see which module is the cause of this
performance problem.
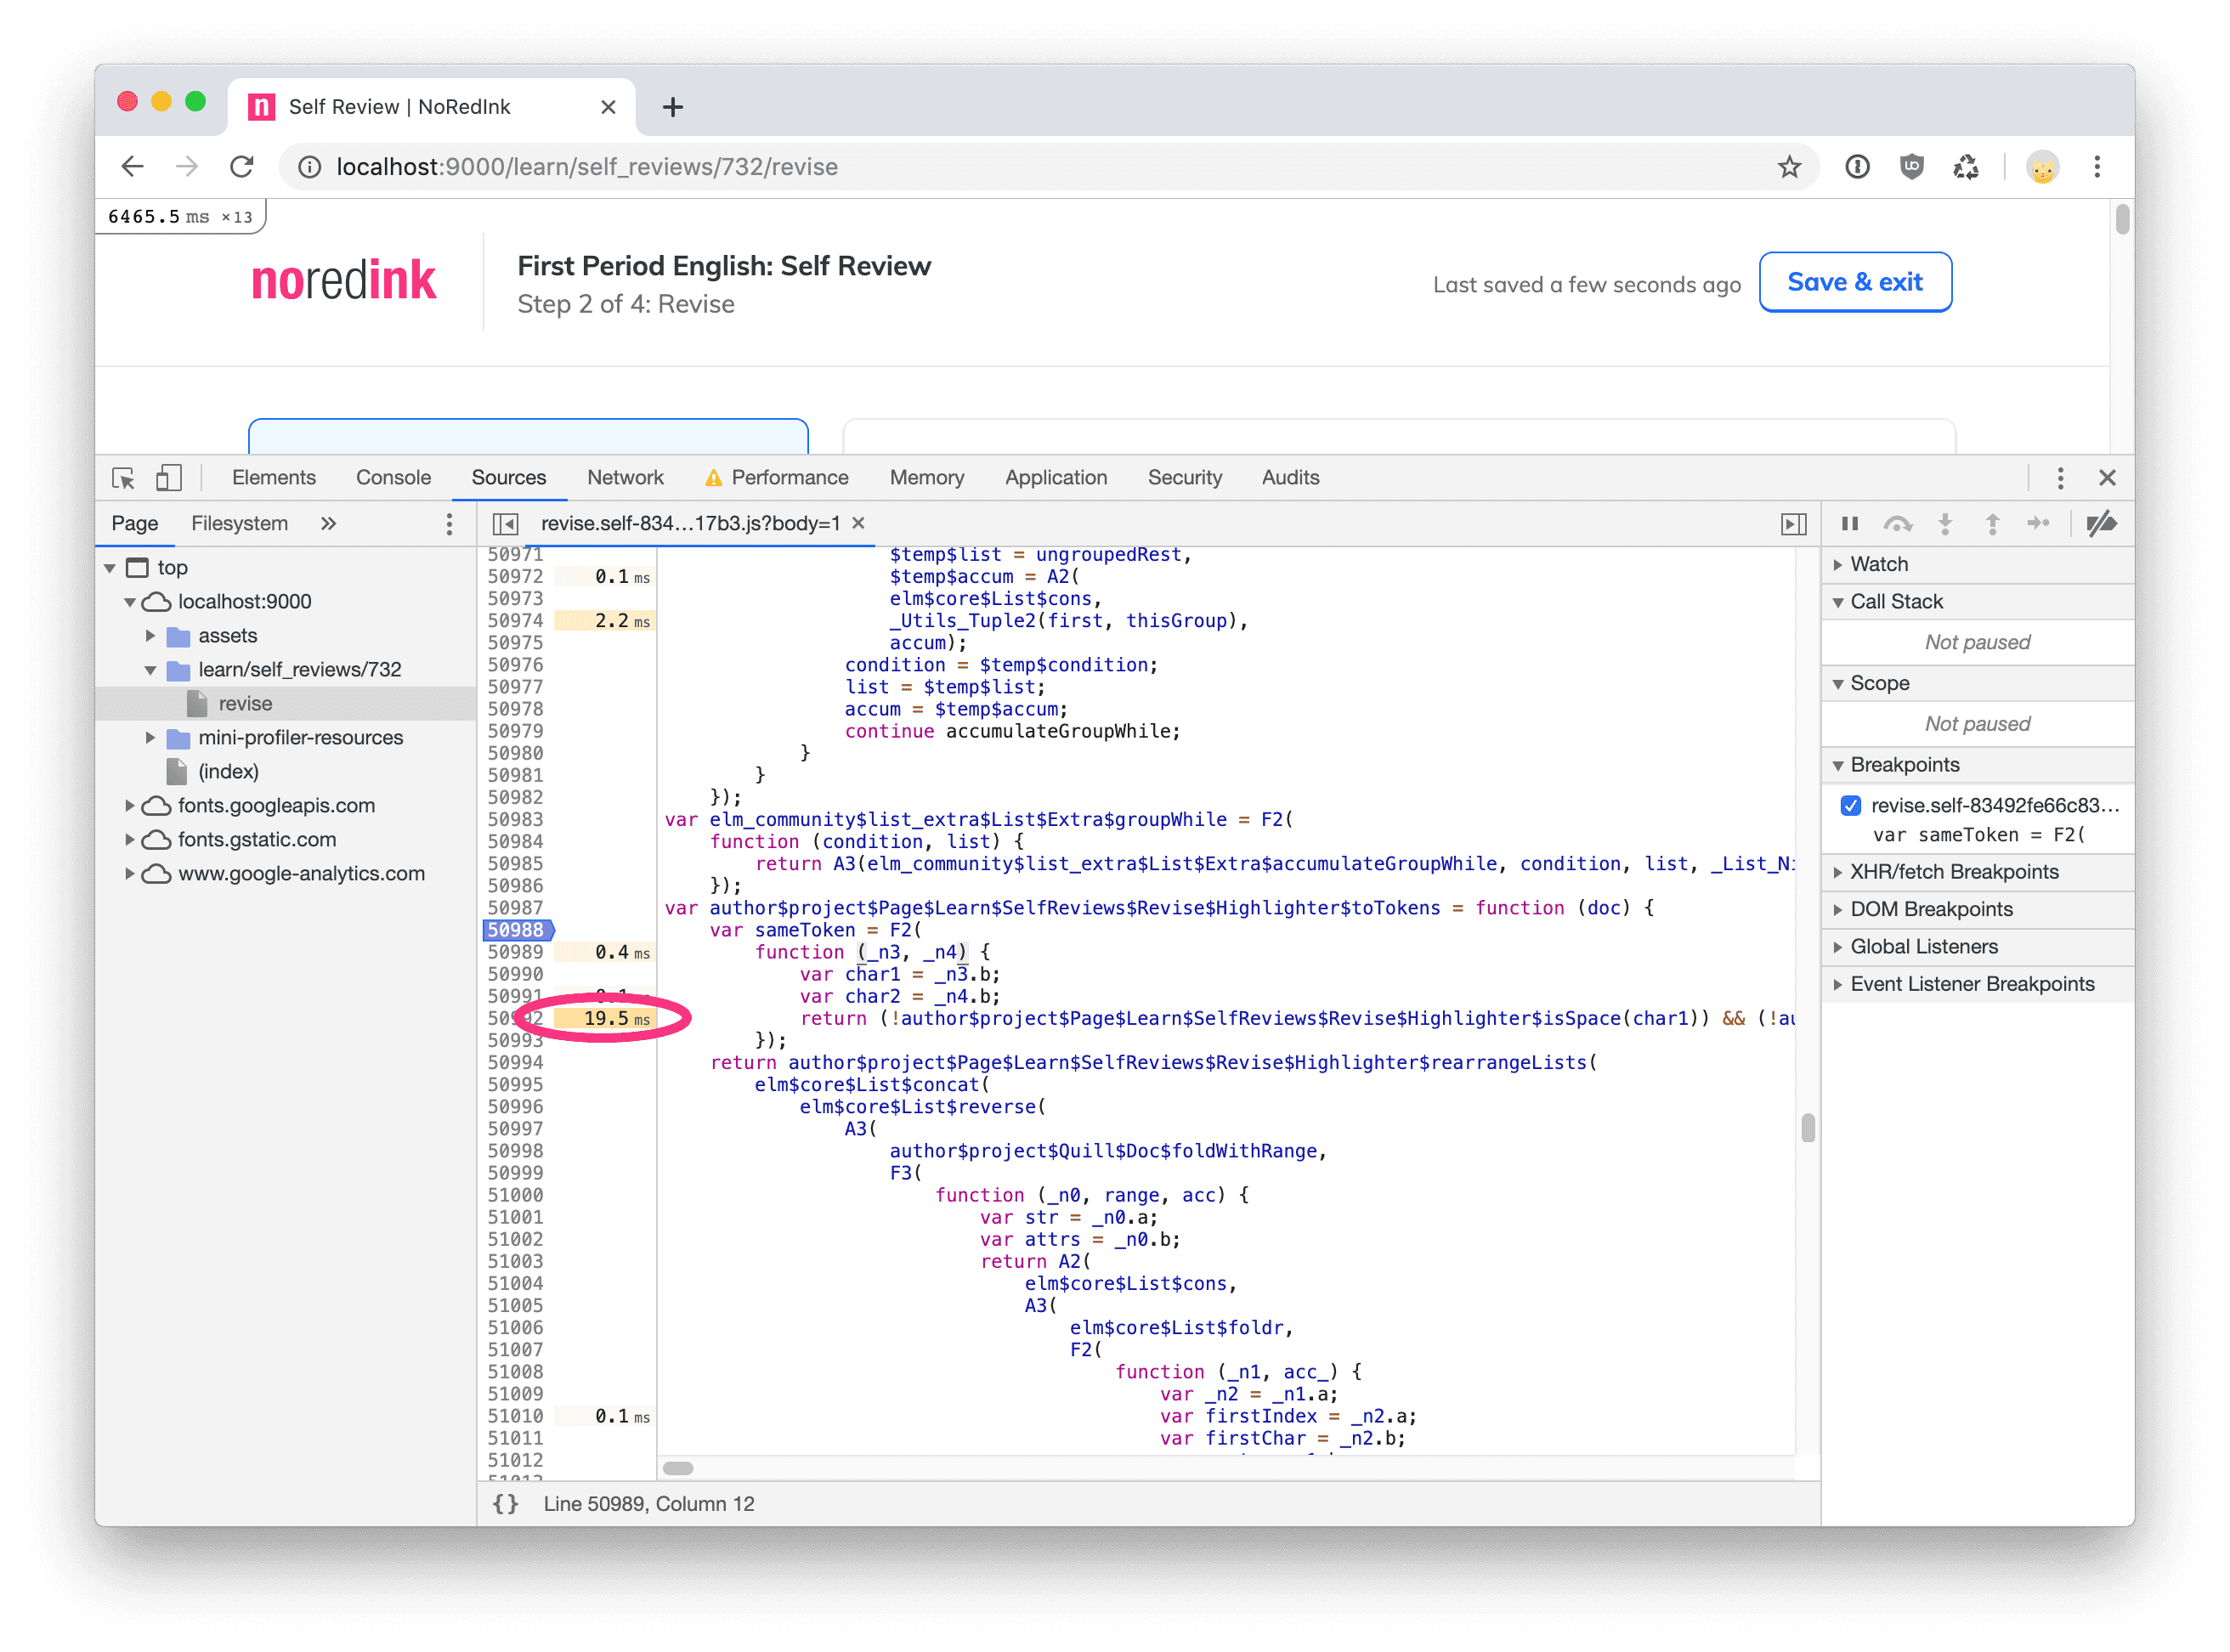
As you can see, the function causing slowdown seems to be the aptly named
author$project$Page$Learn$SelfReviews$Revise$Highlighter$isSpace. Let’s
look at what that function does:
isSpace : Char -> Bool
isSpace char =
    List.member char
        [ ' '
        , '\t'
        , '\n'
        , '\u{000D}'

        -- what follows is a list of unicode characters used
        -- as spaces: http://jkorpela.fi/chars/spaces.html
        , '\u{00A0}'
        , '\u{1680}'
        , '\u{180E}'
        , '\u{2000}'
        , '\u{2001}'
        , '\u{2002}'
        , '\u{2003}'
        , '\u{2004}'
        , '\u{2005}'
        , '\u{2006}'
        , '\u{2007}'
        , '\u{2008}'
        , '\u{2009}'
        , '\u{200A}'
        , '\u{200B}'
        , '\u{202F}'
        , '\u{205F}'
        , '\u{3000}'
        , '\u{FEFF}'
        ]
Uh! That is really surprising. Usually iterating over a list is really fast, but in this case it seems that we are spending almost 90% of our time inside this function. As you probably know, the algorithmic complexity of iterating over a list is O(n): we could easily improve that by building a set that contains all the desired characters and checking if the current character is part of that set. The Elm standard library implements a set using a dict, which is in turn implemented using a red-black tree, which means that the time complexity will become O(log(n)).
So we can change the code that looked like this
sameToken ( _, char1 ) ( _, char2 ) =
    not (isSpace char1) && not (isSpace char2)
into something that looks like this
-- This is a very hot path in the code. So we build a set once
-- and use it to determine if a character is a space or not.
spaceSet =
Set.fromList spaceCharacters
sameToken ( _, char1 ) ( _, char2 ) =
not (Set.member char1 spaceSet) &&
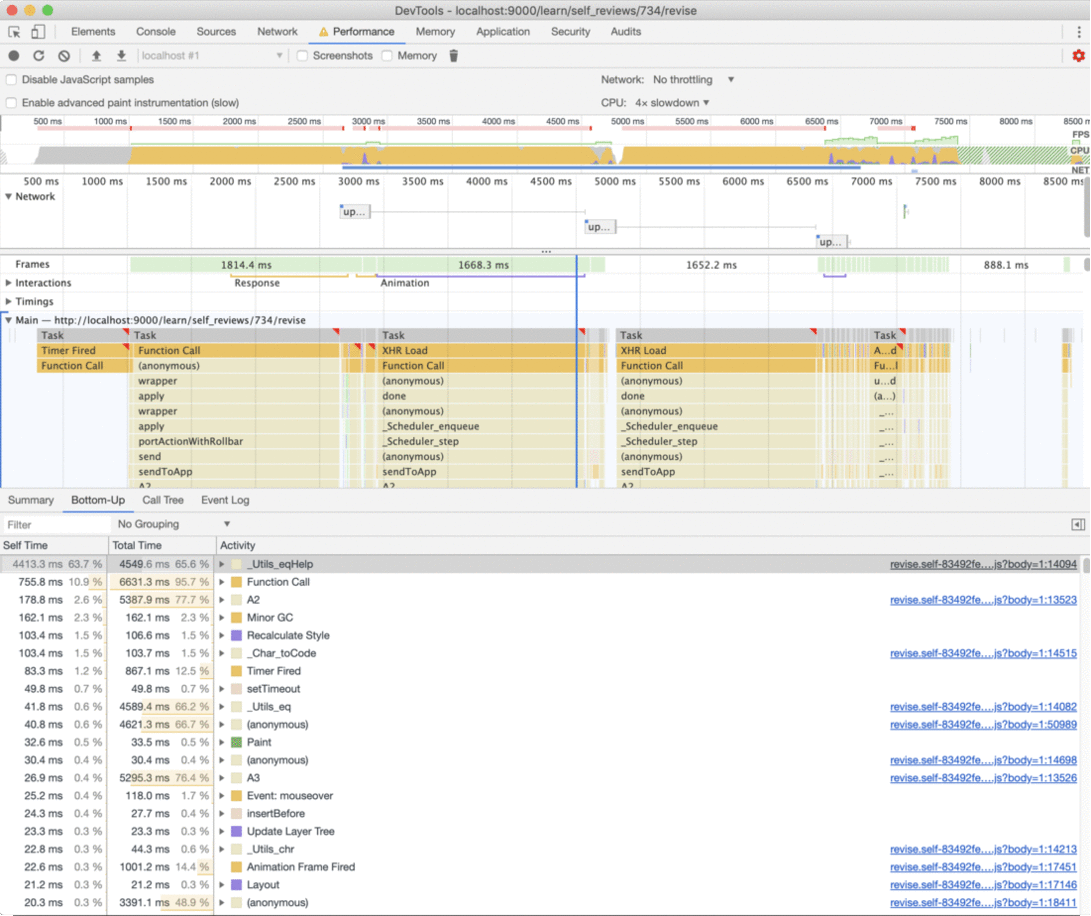
not (Set.member char2 spaceSet)With this little change in place, we can repeat the performance measurement
Now our browser is spending most of its time adding elements to the DOM
instead of just comparing things. We can also notice that there is no huge
outlier anymore: the current top function, appendChild, uses 15% of the
total time while previously _Utils_eqHelp was taking almost 90% of the
total time. When we try clicking around the application, we notice an
extreme performance speedup when using the application. Albeit this is
still not optimal, it’s a huge improvement with a very small code
change. Look at how the shape of the performance graph has changed:
I hope that after reading this you will be less intimidated to dive in
performance measurements and get the most out of your browser inspector. In
future blog posts we will explore what else we can do to make our Elm
applications faster, in particular using Html.Keyed and Html.Lazy.